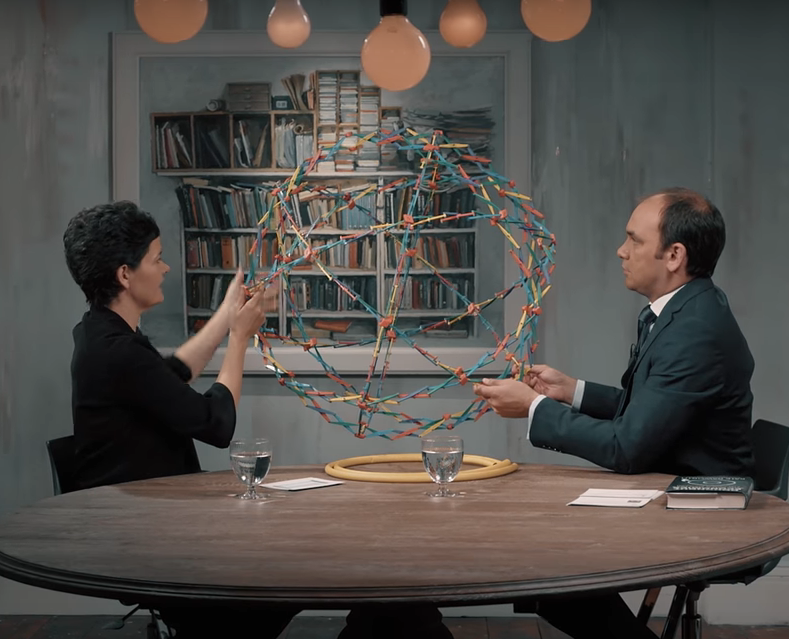
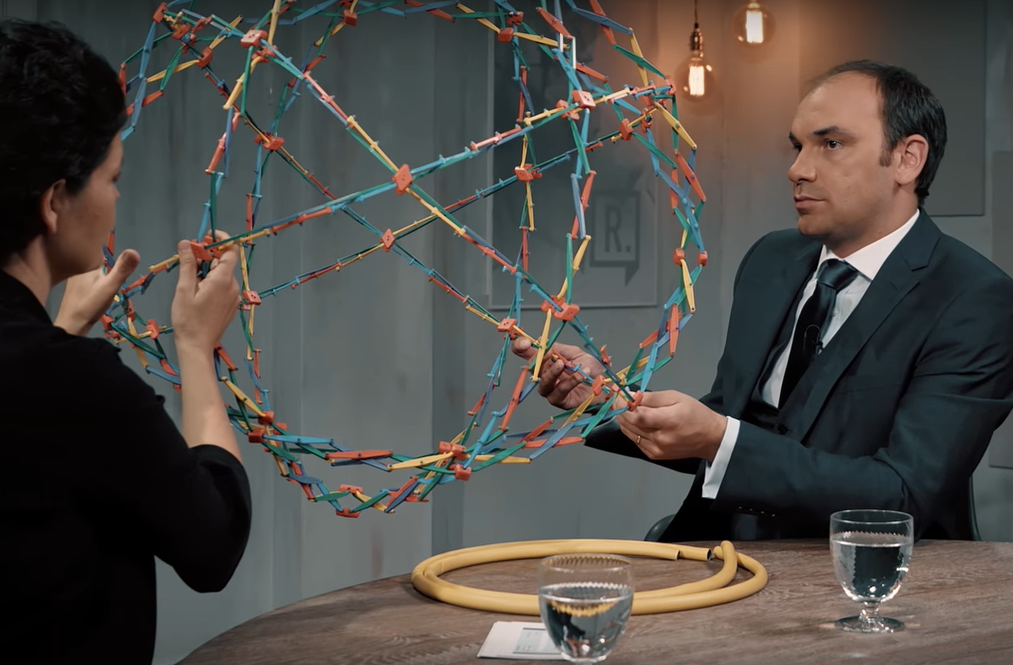
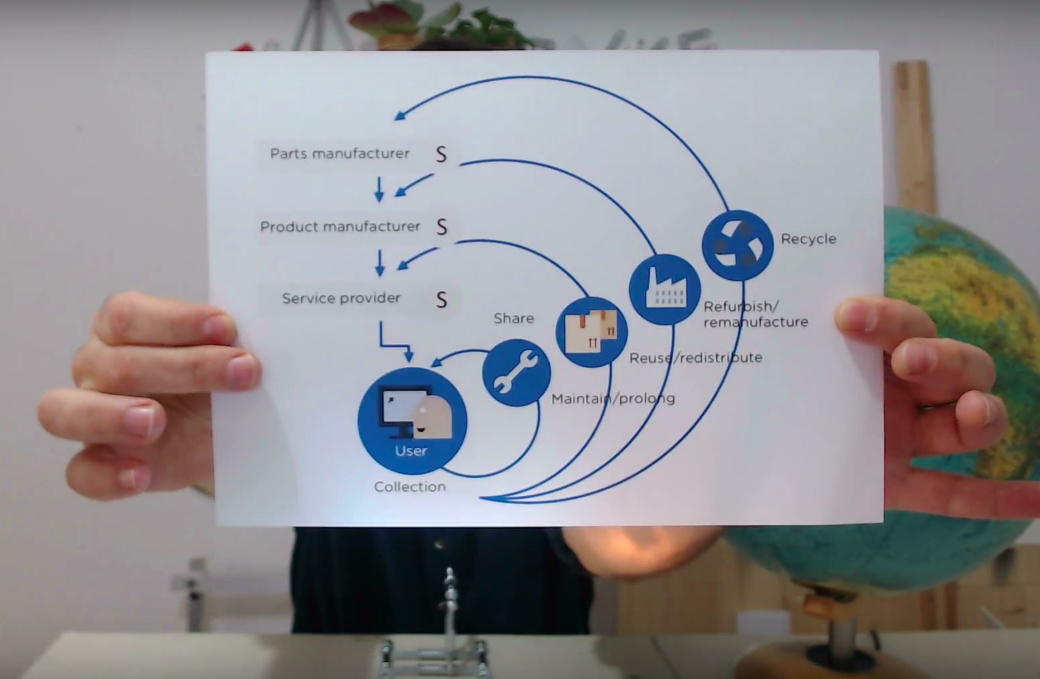
Ha! @RicardoRug found this. Kate Rawsworth explaining OSCE and she is prepared! She brought her visuals (3min Video)

She even used the “10 000 things” bit Sam and I used from the beginning of OSCE 
Ha! @RicardoRug found this. Kate Rawsworth explaining OSCE and she is prepared! She brought her visuals (3min Video)
She even used the “10 000 things” bit Sam and I used from the beginning of OSCE
In my mind I imagined a diagram that uses the distributed production one as a basis and maps icons for users / suppliers / producers onto it to illustrated multiple transactions in a non-centralised way…Today I saw a paper from South America that develops this exact same idea. You can read it here.
http://pdf.blucher.com.br.s3-sa-east-1.amazonaws.com/designproceedings/sbds-issd-2017/042.pdf
At some point we should settle for one, even if we will change it later. There is the risk of spending too much effort on symbolism and finding the most impressive visuals (like the play Kate is doing) and not enough on making the model happen.
I do like the distributed network concept and visual as being the closest to OSCE. I see a few criteria to be included in final diagram we will settle upon:
Economy is nested in society which is nested in nature. In other words, economy should be shown in its proper place withing the planetary life supporting cycles.
Humans and all other living things are at the core of OSCE model, not materials, not products, not money. It’s funny how there are humans are only users or consumers surrounded by all kind of stuff in the EMF diagram.
Localization and globalization or cosmo-localization are equally critical to OSCE, so we have to reflect clearly both global open knowledge sharing and local design/making/consumption. I view knowledge as the most important flow in our concept of OSCE.
If Gien or others can take the distributed network and adapt it to reflect these criteria and the definition we will adopt, I think that would be great.
I am not good at artistic visuals, but for reference here what I use for CE.
Circular Economy Visuals.pptx (820.8 KB)
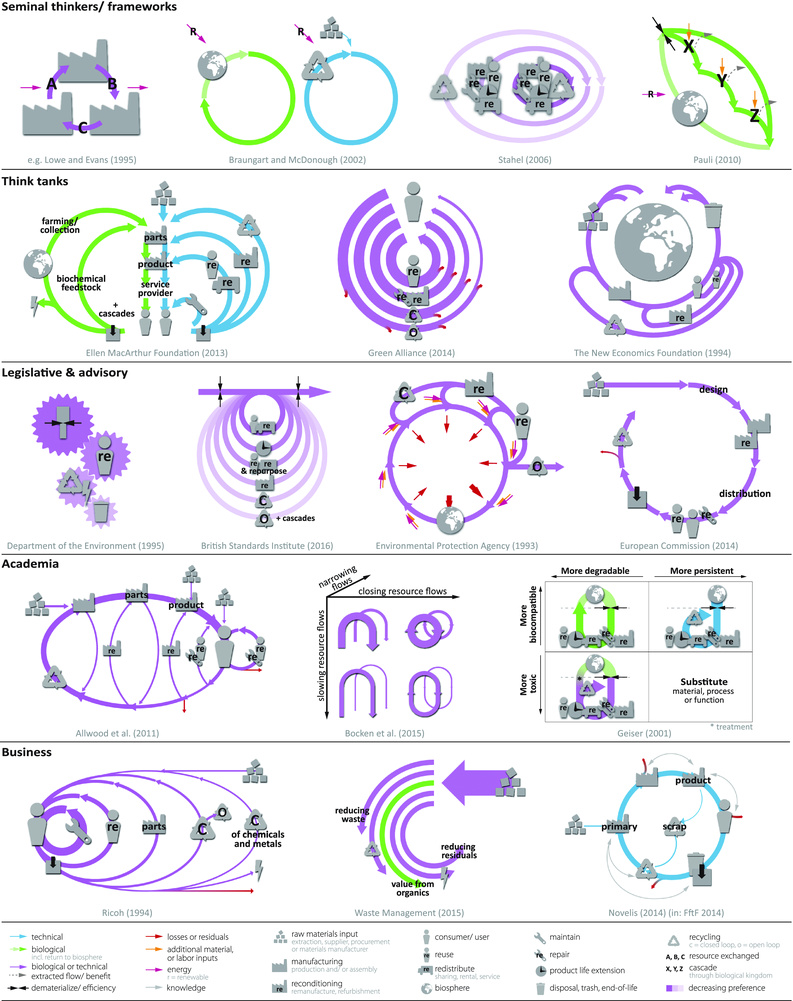
I came across a comparison of schools of thoughts images on CE which may be useful for picking the best elements from.
Source: The Emergence of Circular Economy: A New Framing Around Prolonging Resource Productivity
I tend to think more and more that resource efficiency and circularity comes as a result of a different economy centered on inclusive human development. Currently the discussion of CE is about how do we make the economy circular, pointing mostly to the surface and the resultant behavior of today’s economy.
In my view if the economy is centered on human development (in its broadest term), it demands of regenerative infrastructure (the way we solve agriculture, mobility, housing, healthcare), as well as full employment of human-natural resources (including the circular loops).
Why the economy takes, makes and disposes (not only products, but mostly people, entire regions, communities and nature)? What drives this metabolic spiral?
What type of economy would do the opposite? What type of economy would employ the worlds human capacity in its full potential and would develop the necessary things(products, infrastructure) to make it possible?
How this translates into an agenda of partial, but aligned, economic interventions that articulate in this new context? What is currently happening today that is representative of these interventions (Open Source is clearly one of the big things, but there are more stuff)? What movements, technical development, financial opportunities etc, can we identify?
#Design Files
In case someone is keen to start with a design process: Here are all open design files of OSCEdays to use and build upon.
Although the EMF diagram may not be complete, it’s been quite useful to communicate the basics of circular flows to people that are just starting out. Therefore, I would support keeping it as a base, with the suggested Plurals (e.g. manufacturerS) and adding a third resource flow for knowledge.
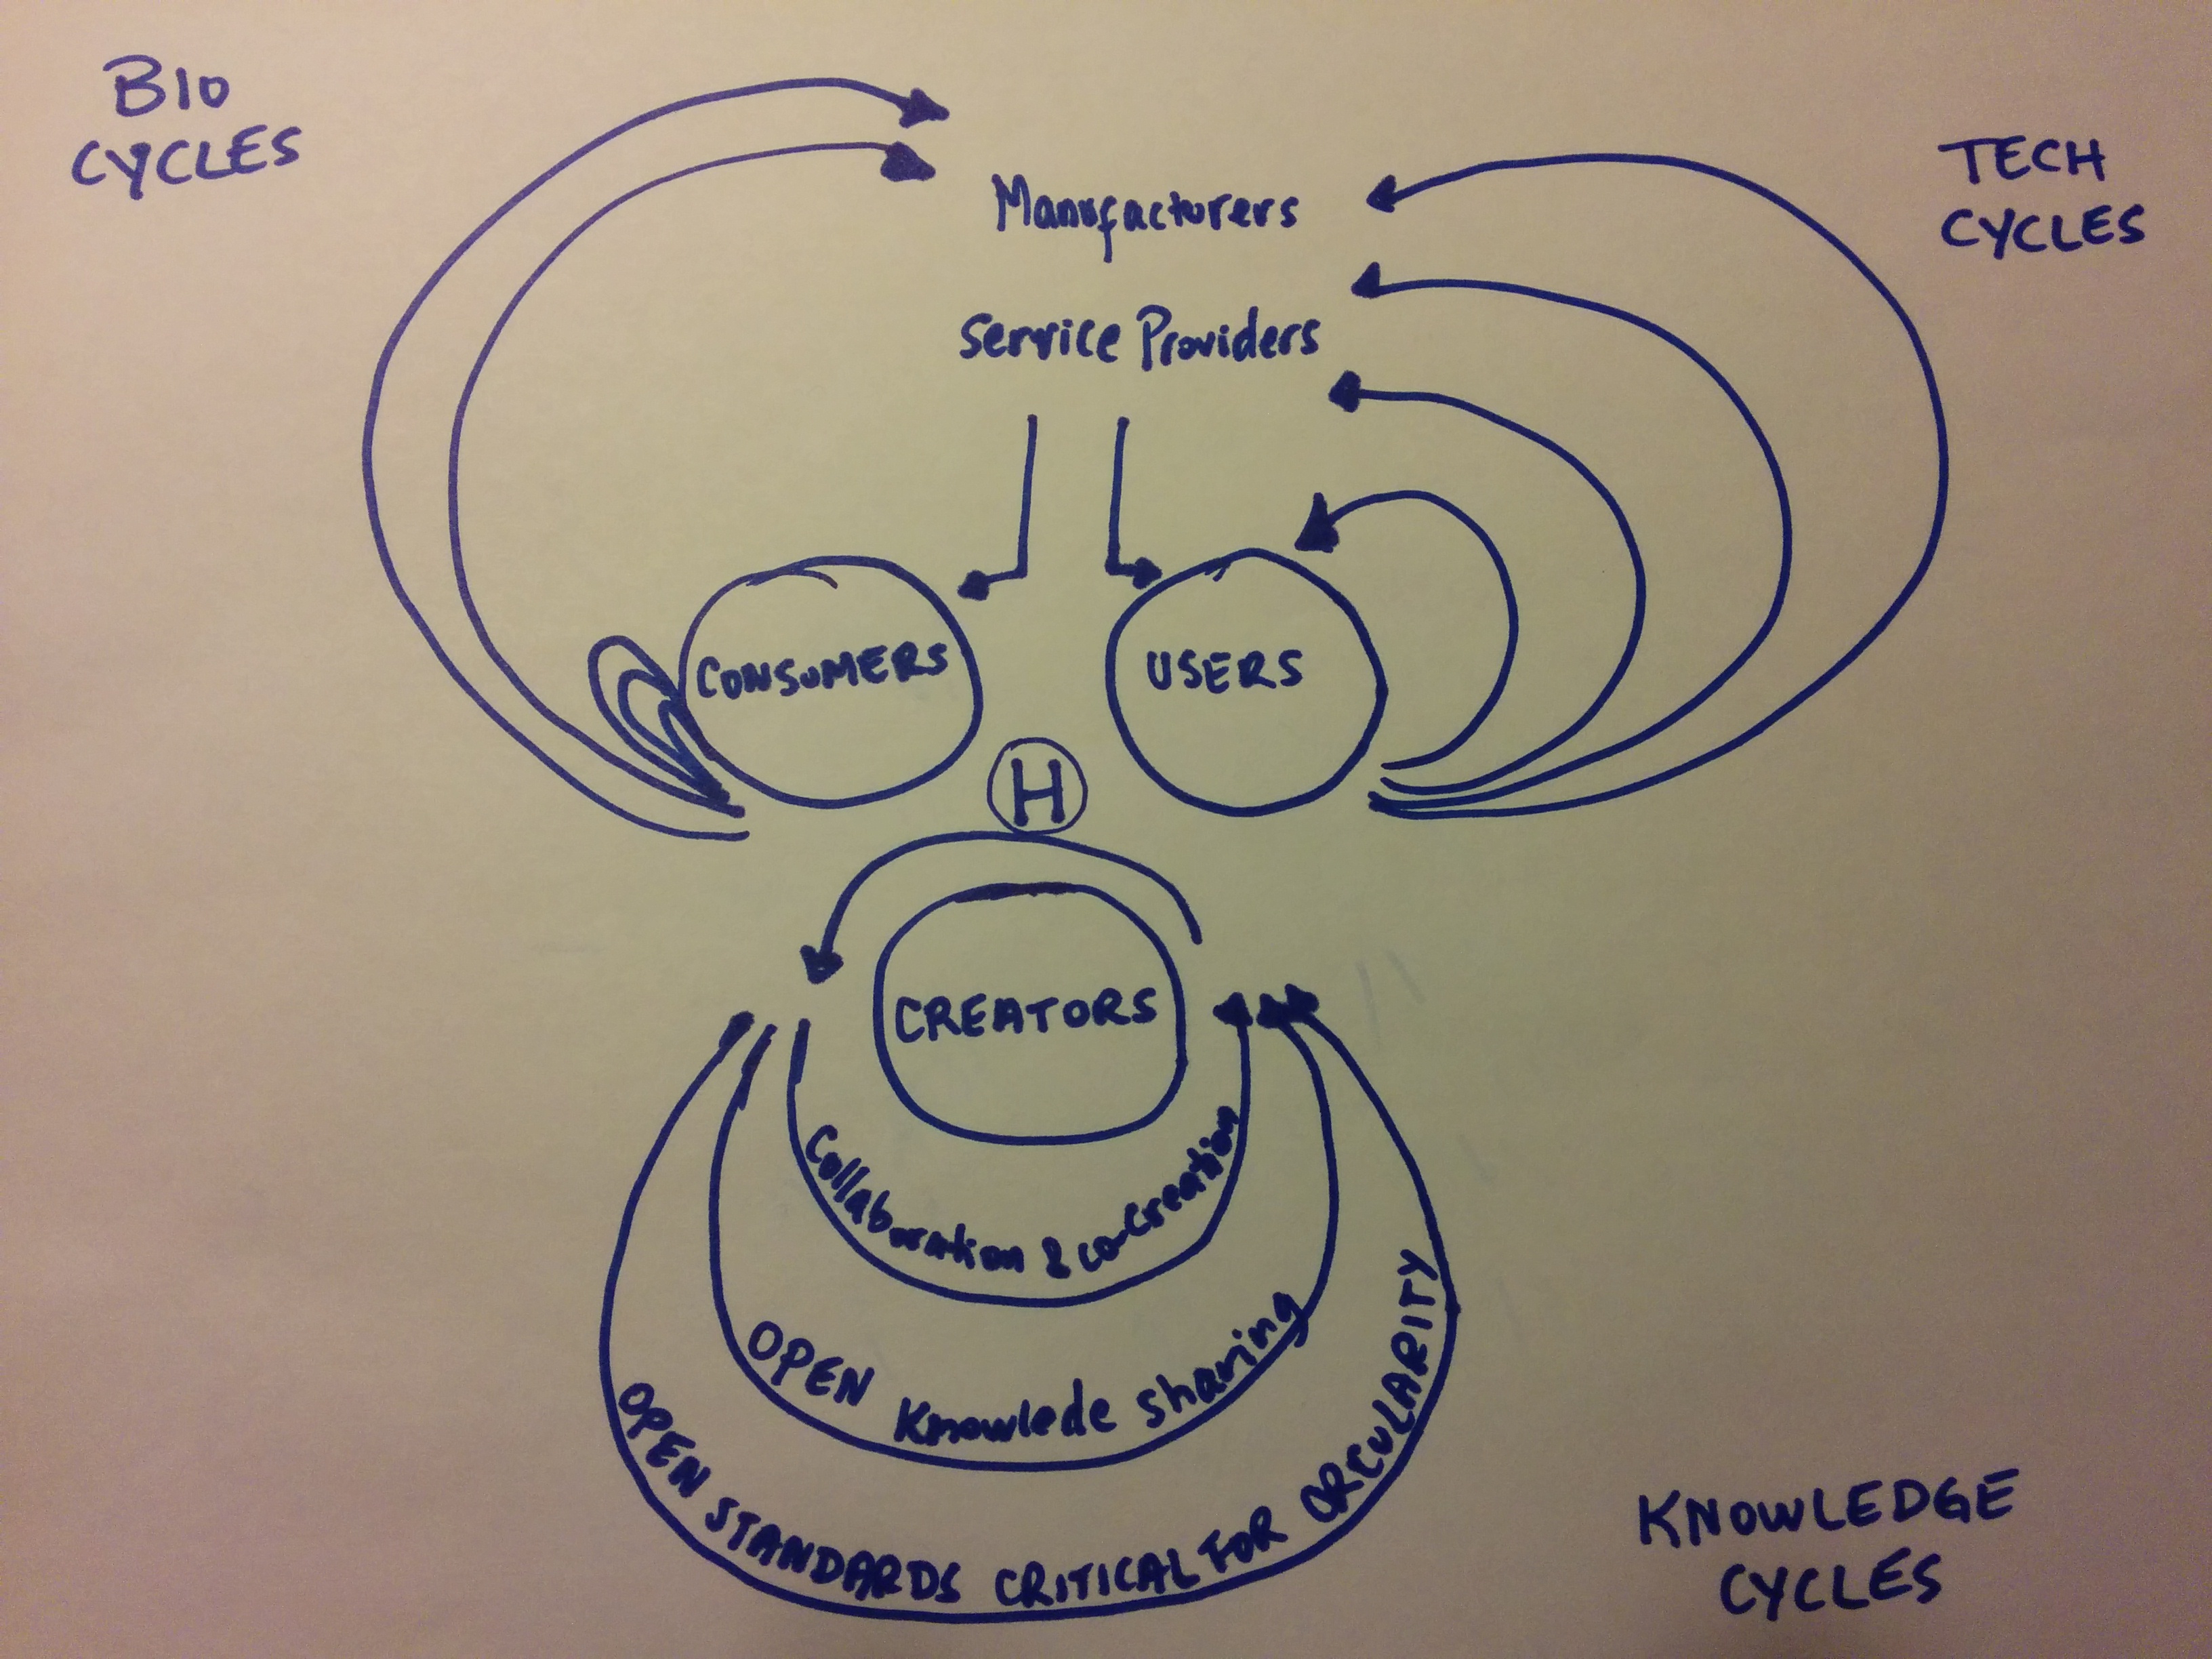
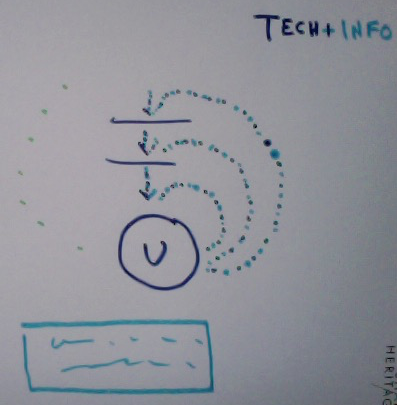
Here’s my attempt at incorporating this third cycle (apologies for my limited drawing skills).
The H in the center is for HUMAN as a reminder that we are more than users, consumers and creators, and the human capital is the most critical resource to make the rest of these flows a reality.
And below (in case my writing is not legible) it says:
First loop: collaboration & co-creation (this would be the highest level of sharing that we would strive for)
Second loop: open knowledge sharing (this would involve the sharing of data and skills, but not necessarily working in collaborative way with one another
Third loop: open standards critical for circularity (this would involve only sharing what is absolutely essential to enable circularity to happen in certain systems)
What I think is missing here is the currency/money flow. It may not be essential to convey the OSCE concept, but I do think that how we use currency (in broad terms) to enable all these interactions is also important to have a holistic picture of a circular economy.
I’m playing with these ideas, so of course I’d appreciate your feedback on this
Hi @Paula
This is great! Yes. Putting everything in PLURAL is definitely key.
I thought about your other additions. I think you are absolutely right to put something at the bottom addressing information. But is it really necessary to have more arrows. The diagram has already enough of them Also it might look like the information (bits  ) is going on different roads than the products (atoms
  ) while they should be probably more intertwined.
How about this: Putting a light blue box at the bottom saying something like: “Requires free information and simple designs. (To drop the costs for collaboration)”
And make the arrows in the technical cycle dotted in two colors to show that info and products go together?

In addition we could call it “Technical Materials & Information” at the top right.
And somewhere as text maybe something about “distributed networks of circularity”.
I think when it comes to economy we should think of it as “human needs” centered (referring to human needs theory, https://en.wikipedia.org/wiki/Maslow’s_hierarchy_of_needs) because that is the whole point of doing all the things we do that we call “economy”: we want to fulfill our needs for survival and ideally also a good life (whatever that is in our individual perspective). So a picture could try to include this, only I don’t know how…
When it comes to cycles we might want to look for schematics of eco-systems rather than CE or other economists who we know are mostly not very good at understanding complex networked circular systems.
Only problem here: nature is not open source, meaning it has no need to document and hand on information, use block chain, co-ordinate… nature does not need to design, assemble, disasseble, re-use, distribute - no need to plan ahead and be in control of material flows and allocation of profits and rewards. It doesn’t need to because it’s not about the survival of individuals but of life itself at the cost of a lot of individual death. For ethically thinking humans that’s now a viable option to treat fellow humans in such a way.
Hey, I think this is a very interesting idea to show it as a pathway - splitting roads - with some kind of half arranged tag cloud! Cool! 
If you can find the time you can try to get rid of the spatial illusion? It makes it hard to understand. And I think it it not necessarily needed. It might look like a little bit like the image in comment 13 - but with other words and concepts attached to the parts of the image.
Excellent! My suggestion is to add in the network’s background an image of Earth or of the biosphere that includes humans and many other living organisms. The ultimate goal of the economy (an artifact that has gotten out of control and satisfies an infinite number of wants and an ever reduced number of needs; good or bad, we are stuck with it, so that’s what we have to change) and all human activity should be to preserve a biosphere for all.
I totally agree with the subject you propose about human needs, but I also believe that as @silvia says, we should include nature, perhaps not as an entity that generates or develops opensource, but as an important part of the entire DOSCE chain (distributed open source circular economy), since much of human needs can only be met within a natural environment and thanks to this is that humans can subsist, then the purpose of this economic model is to manage resources so that they can serve for the development of the model but also be maintained by the same model.
ok, let me work on this. I think I can work a little these days. by the way I would also like to introduce in some way what @silvia indicates, since the theme planet and nature is essential in this topic.
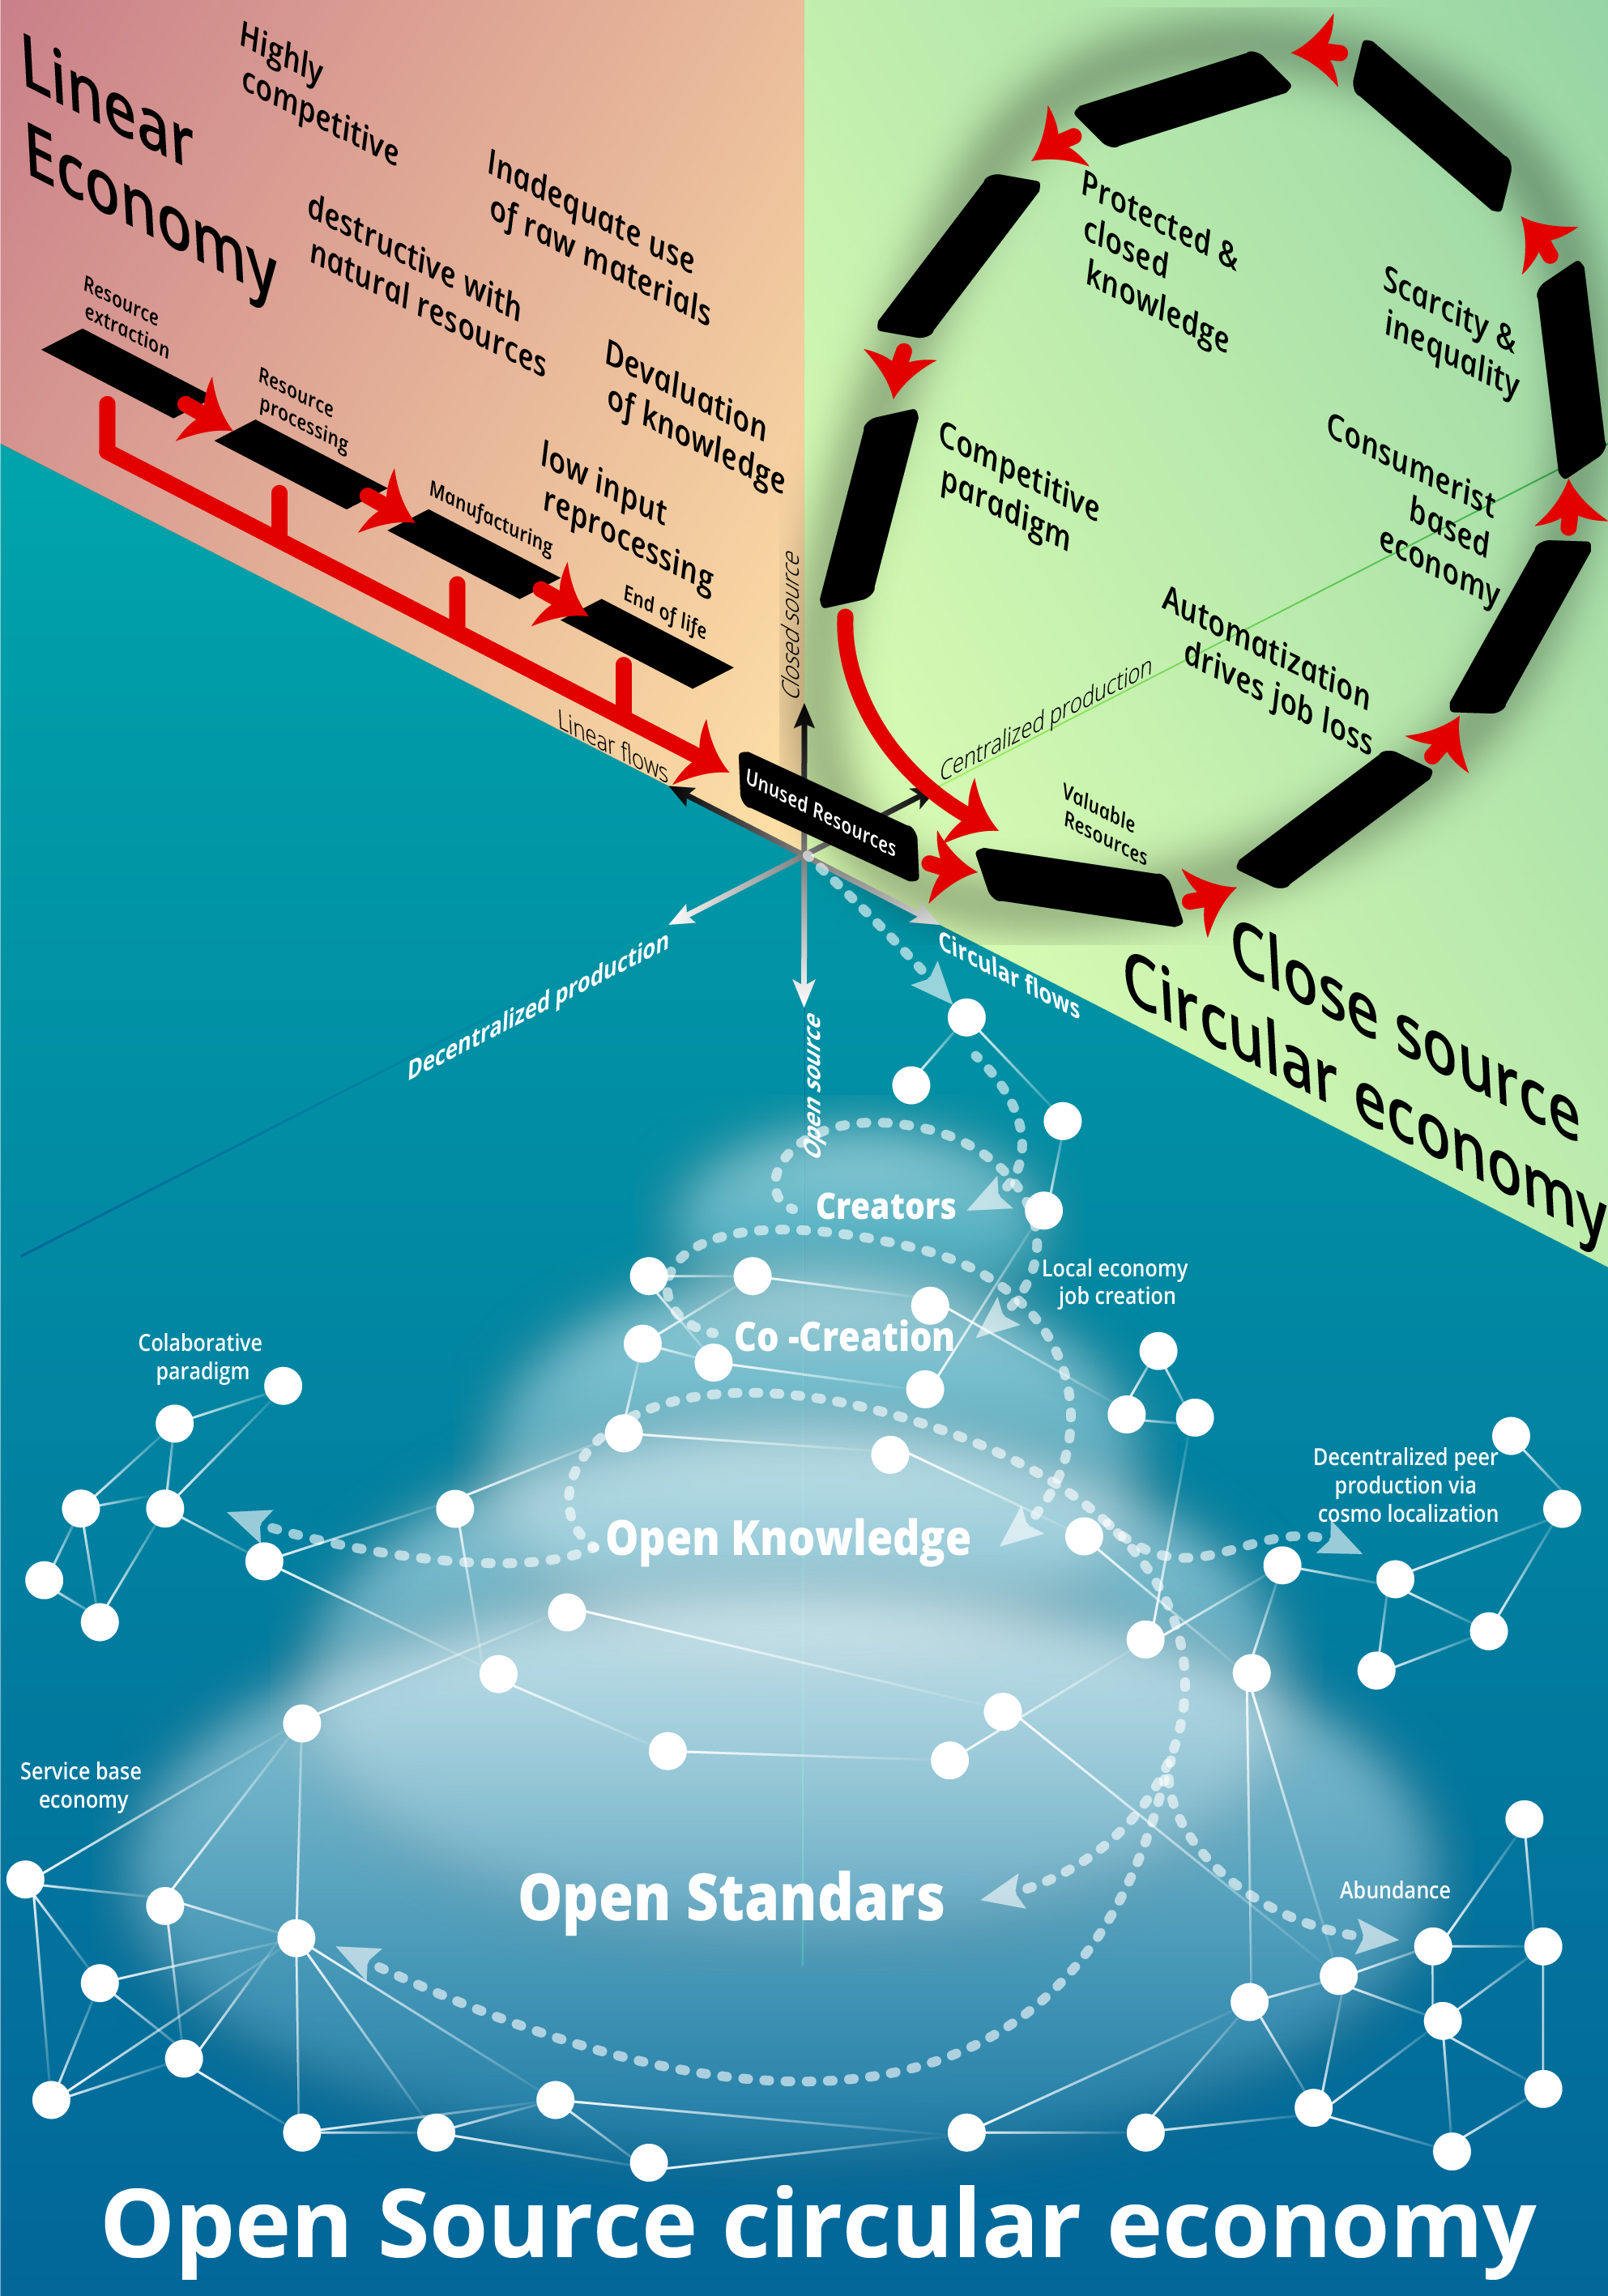
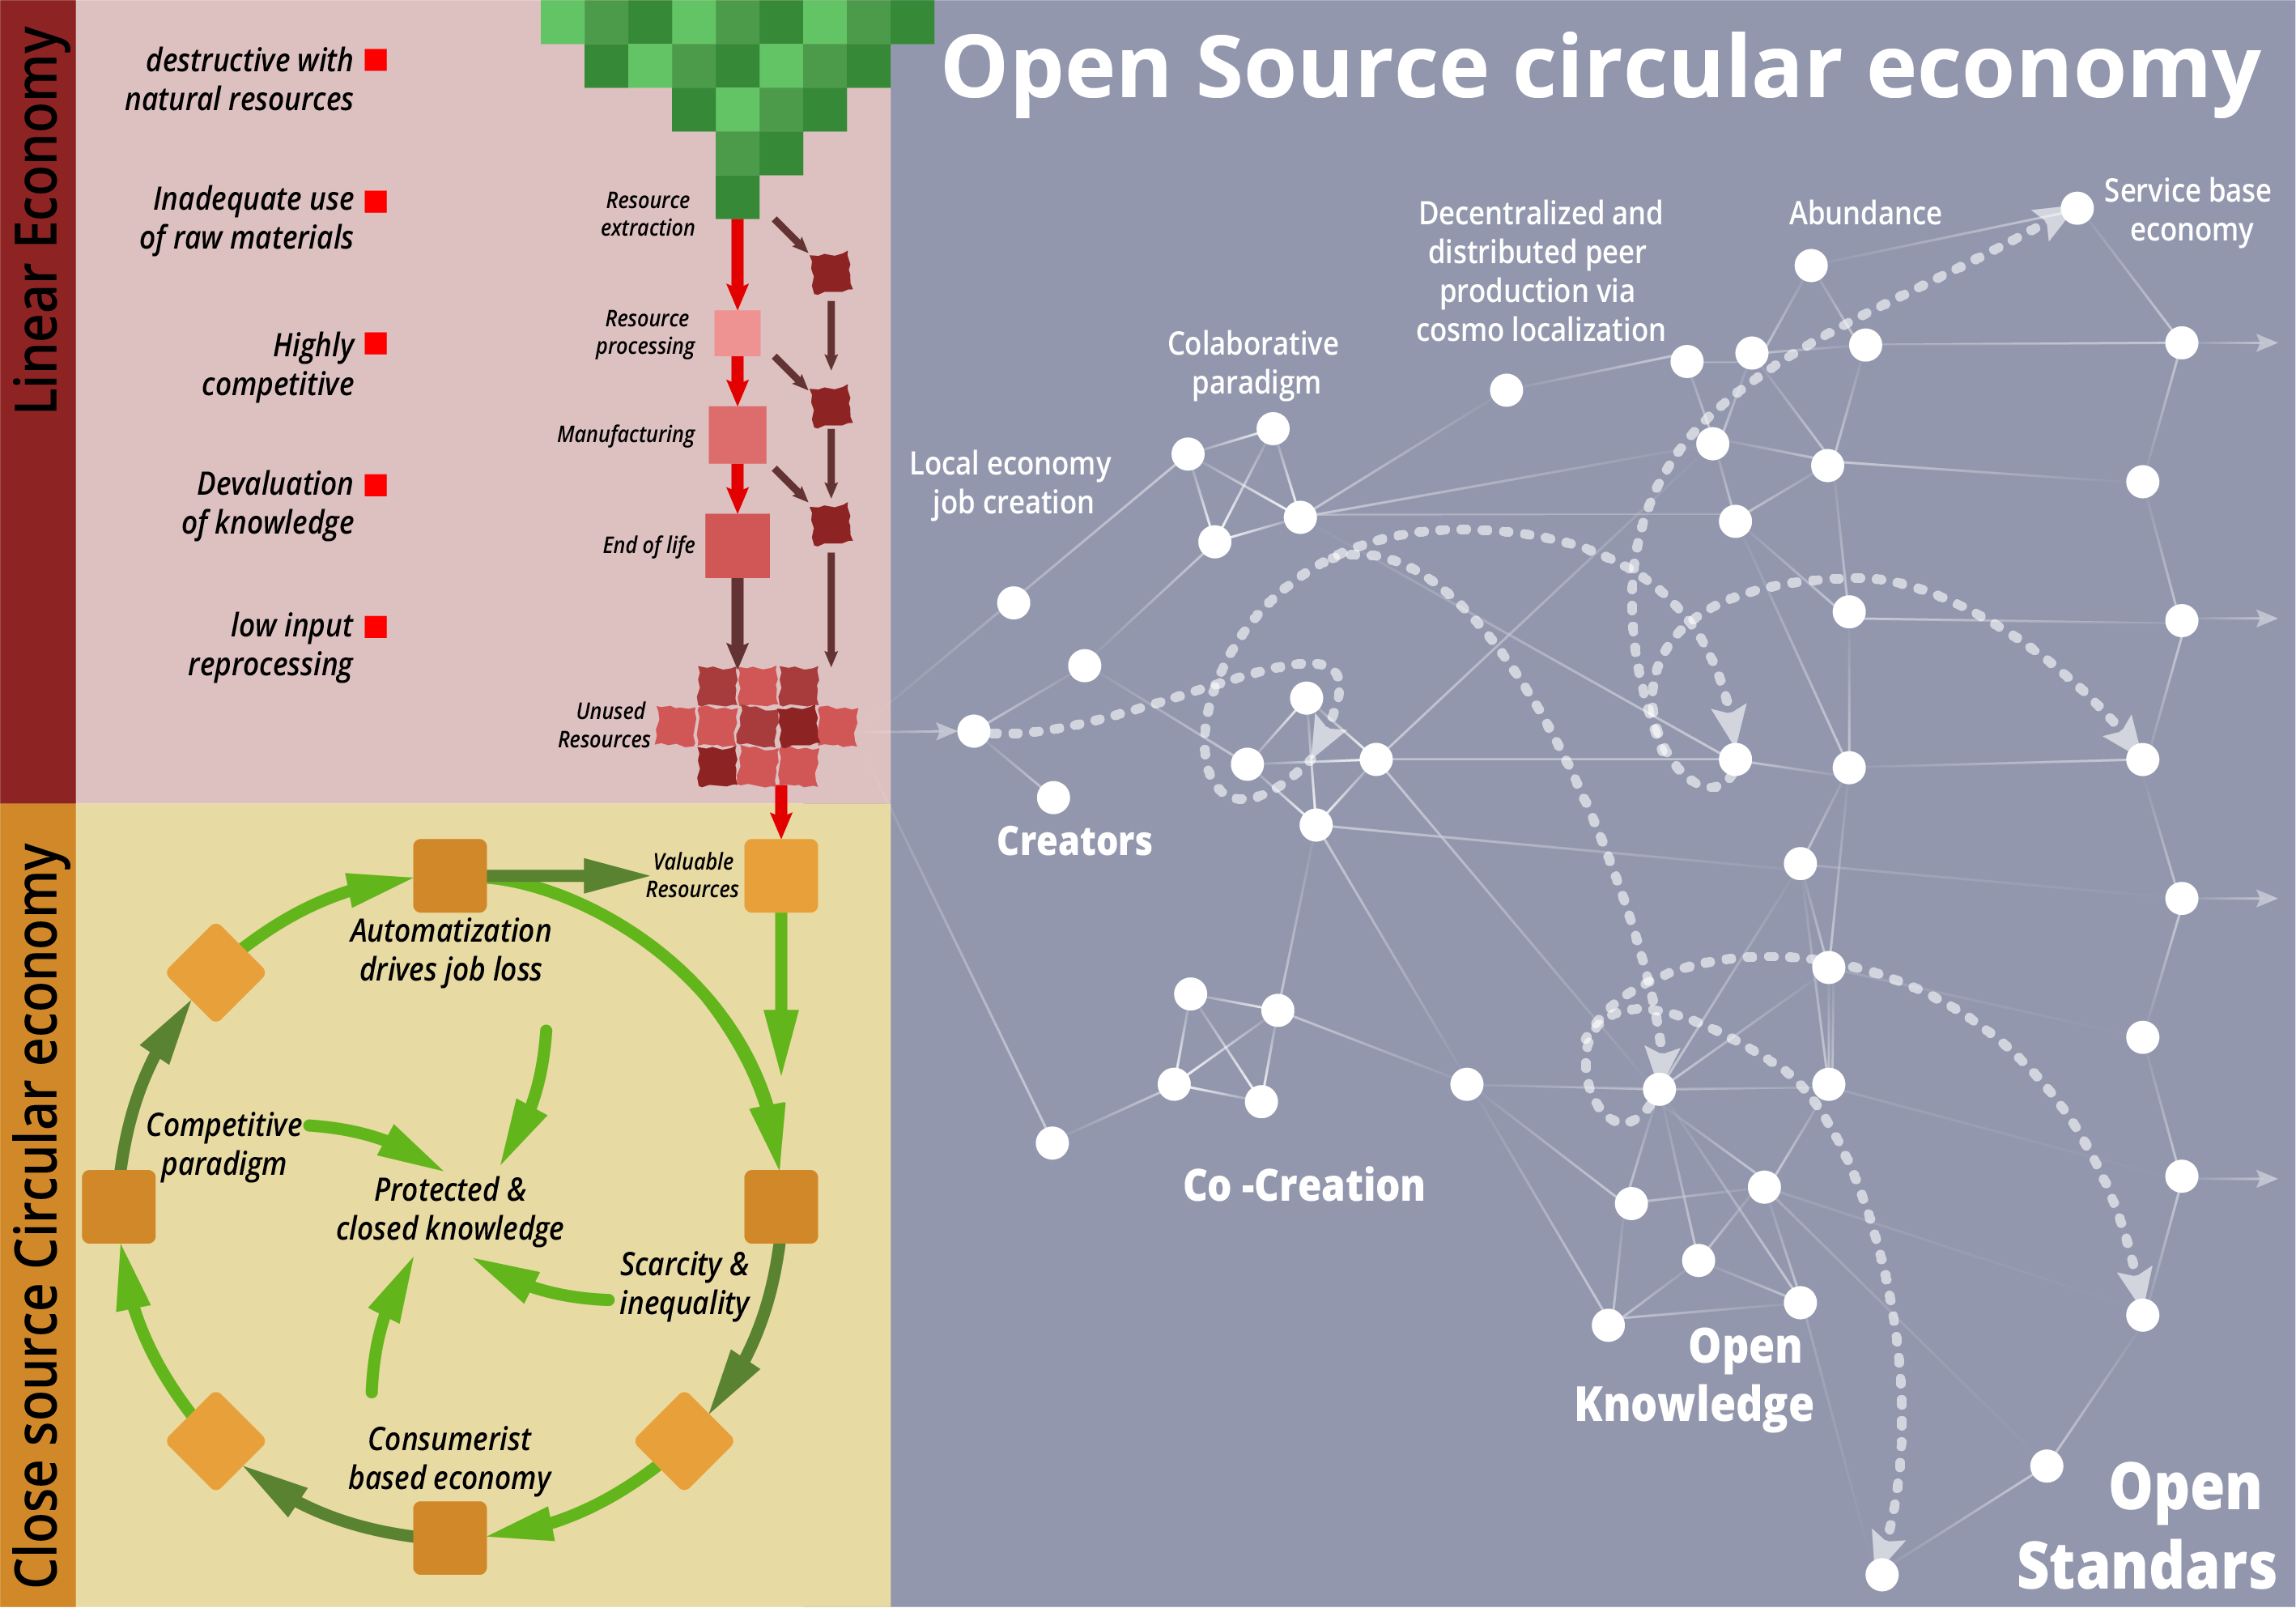
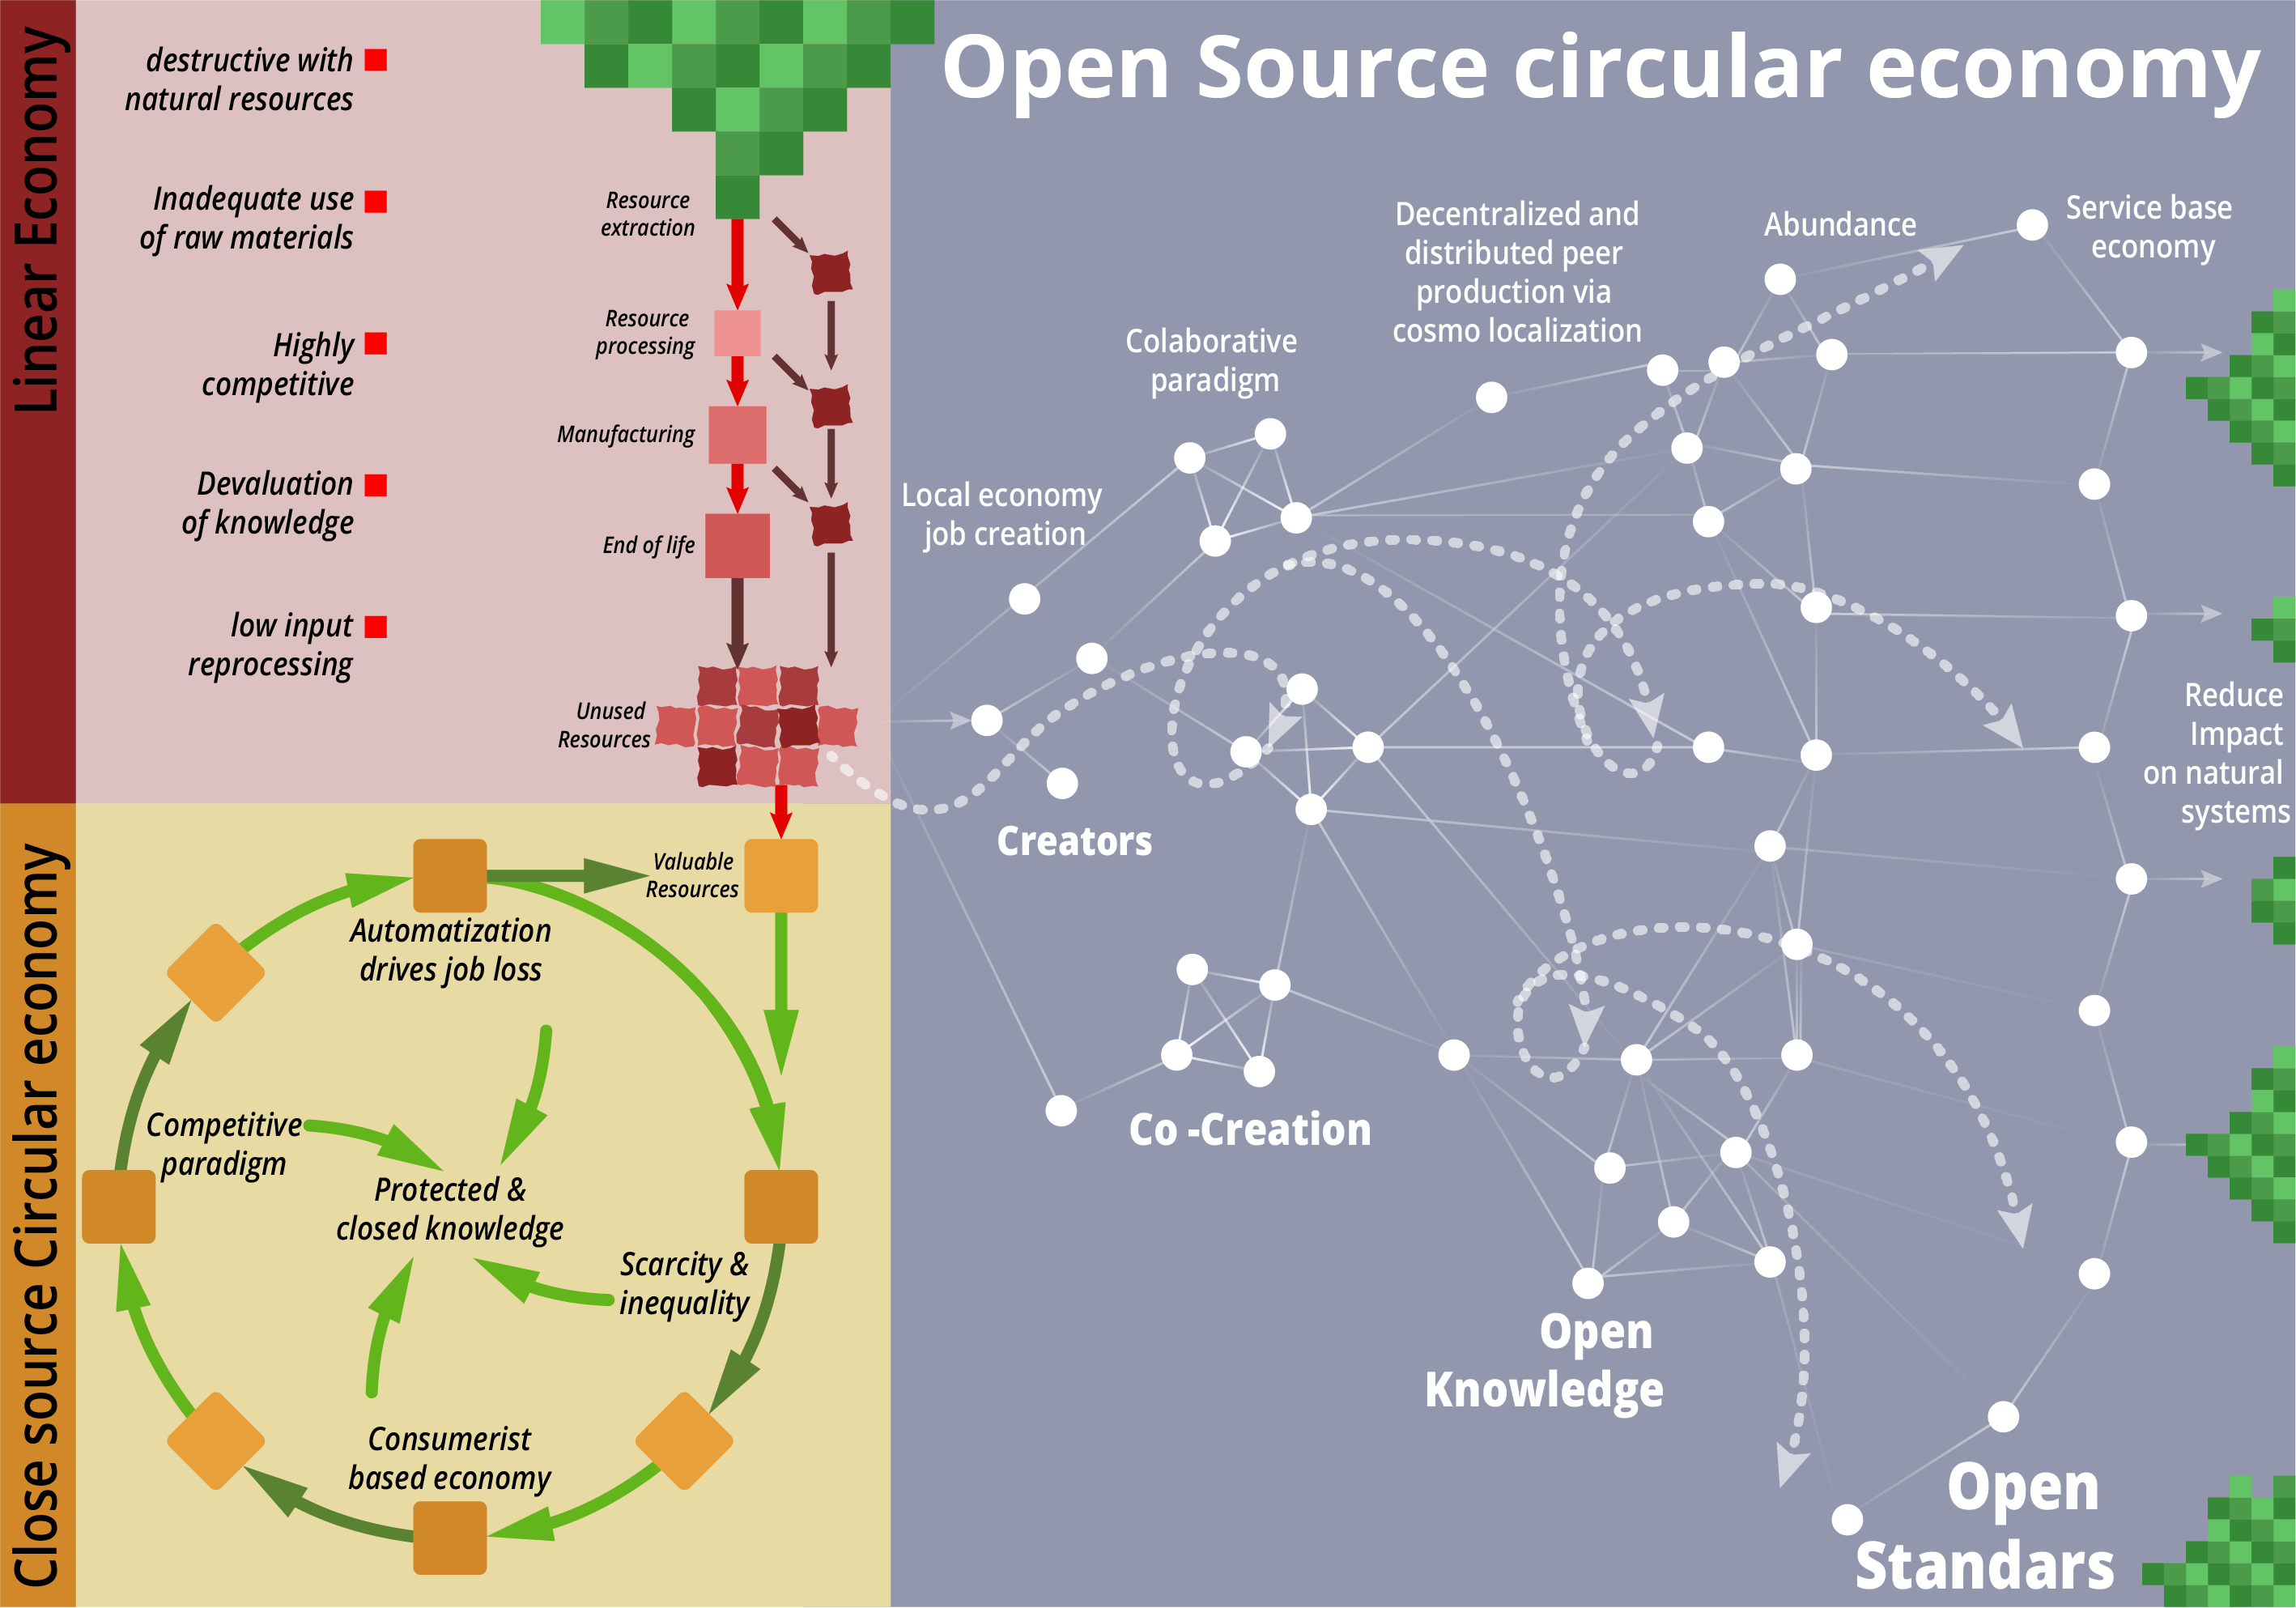
I also invite you to review when you have time the proposed theme for the videos, somehow I think that the exercise of showing the 2 paths can be used to better understand the purpose of osced, for which I was planning to develop it from the point of comparison different types of production. the theme of a linear production, a circular and an OSCE.
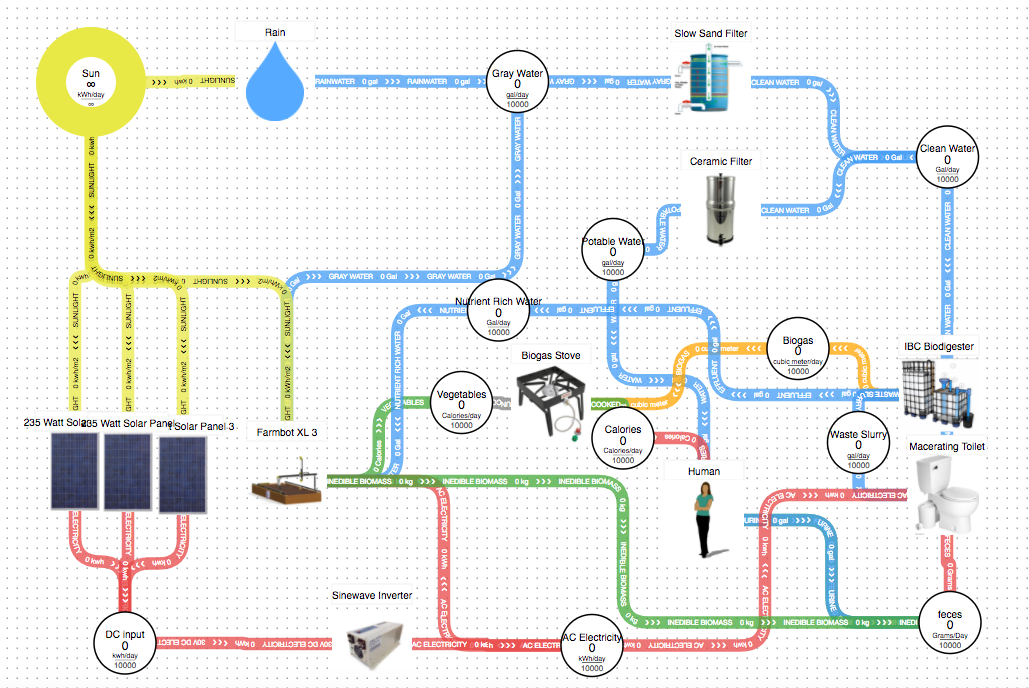
Hello All! First post here, but I’ve been hacking on this same challenge for a few years now! As an ecological designer, I needed a tool to help me map the movement of energy and resources through many inter-dependent sub-systems, both conceptually and over time. I find most mind mapping software to be oddly hierarchical, and drawing by hand to be tedious to the point of futility, so my roommate and I put together this little tool. We call it permablocks or SIM-biosis, but those are just place holder names. Here’s a screenshot. It’s a visual mapping/circuit diagramming tool for designing whole ecosystems out of open-source and/or readily available sub-systems.
It’s only partially functional right now, but you can poke around with a working version here. Drag inputs/outputs on top of each other to create “containers” that map the net-flow of resources between systems. Hit play to see how your simulation does over simulated time-steps (currently days). If your containers run out of resources, they’ll go gray and the simulation will stop (you can ignore container qtys by hitting the option box in the top left, and you can adjust container capacity limits by clicking on a container)
The software is open source (git repo here) and if you want to add your own systems to it you just need to edit the Library.yaml file, which is fairly self explanatory if you happen to be code-savvy person.
This is very much a work in progress, and I would love to both submit it as a tool for y’all to use if it meets your needs as is, and invite others to help make it better.
With a few improvements, it could be a really disruptively useful tool, giving us all a common, open-source, visual and interactive language to map, simulate, and share potential ecosystem designs made up of many interdependent open-source sub-systems.
I’m not attached to using the code we have, but there needs to be an open source tool like this. Perhaps we could have a hackathon to improve our code or build new versions from the ground up. I feel no ownership over the project or idea, I just want a working version I can use!
Potential improvements:
This has the benefit of letting us try out and explore potential connections between systems, and also share interactive diagrams of systems that already exist. We could test our theories against real-life performance, and systematically work to reduce the performance gap between the two. If these library items were then linked to the open-source documentation of these sub-systems (EX: IBC biodigester, Showerloop, Precious Plastic Machines) then you could design a whole ecosystem and have the software auto-generate you a PDF build document complete with BOMs, estimated cost of materials, required tools, CAD files for CNC manufacturing, 3D models, and tutorials.
Excited to see this conversation happening! Onward!
Hello everyone, I’ve just been catching up on the thread after noticing it in last week’s email. Agree it would be great to come up with a better diagram than the Butterfly. What do we want to achieve? Do we want to create something easier to understand? The butterfly looks quite complex to those new to CE. Re open sourcing - is this an extra ‘layer’? I’m not sure how you can build it into the diagram without adding complexity (and so confusion!).
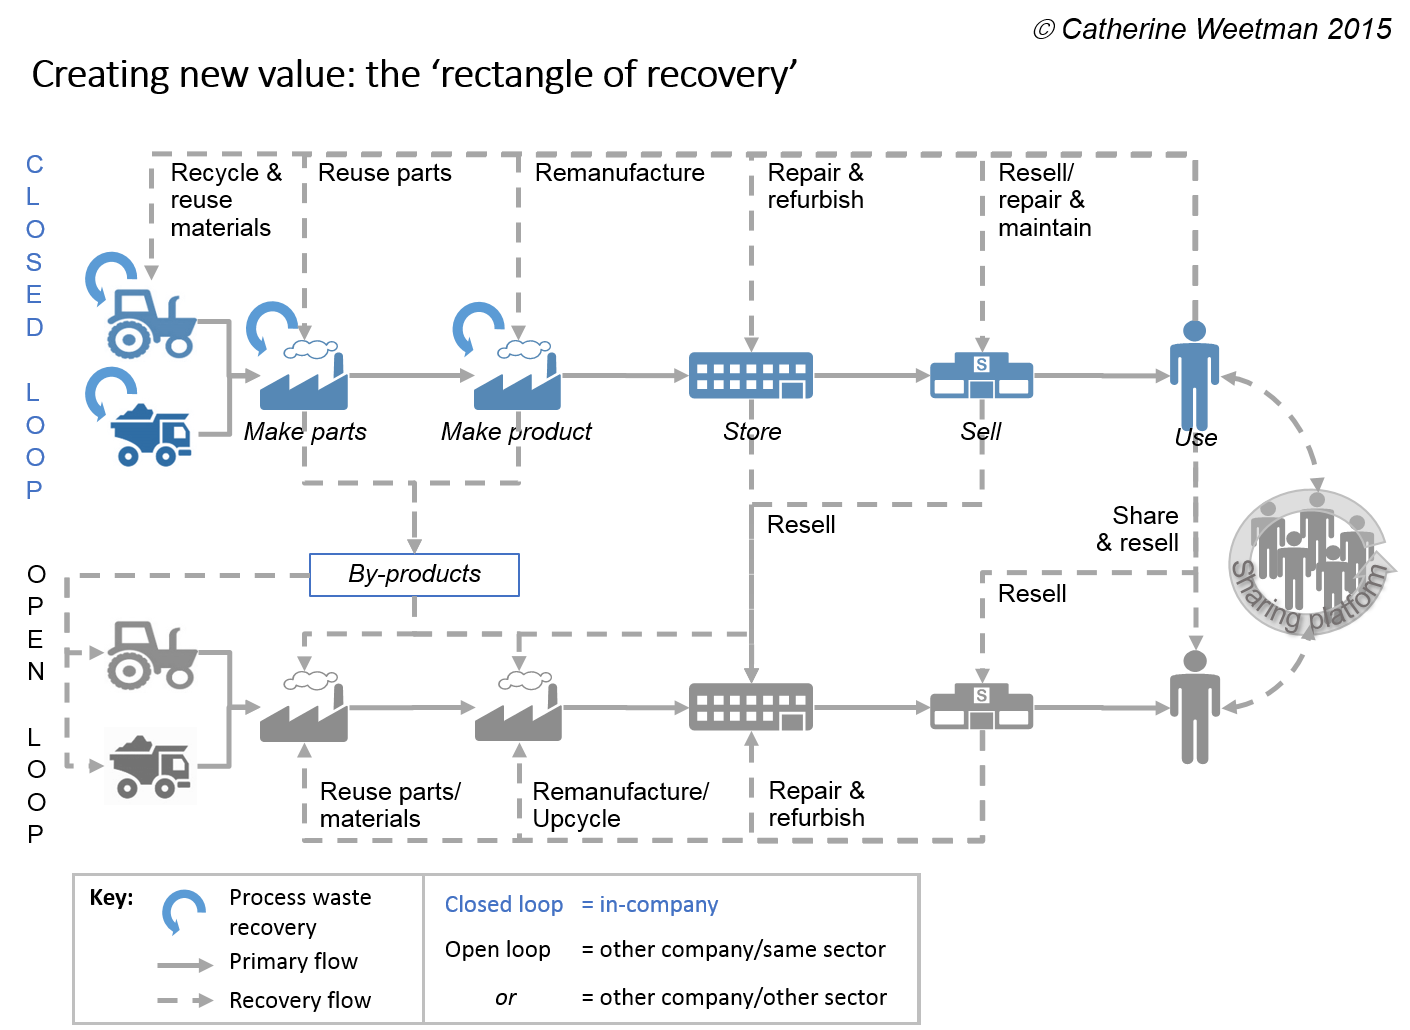
Here is the ‘rectangle of recovery’ I created for my CE book - wanting to ensure I couldn’t be accused of plagiarising any of the ‘circle’ diagrams! I’ve used simpler versions to show flows into other sectors, eg for coffee by-products into food manufacture, pharma & cosmetics, fashion etc. I’d be happy for this to be used/adapted (it would be fantastic to be acknowledged/credited!) if it is of use.
Hi all,
this is great work happening here. I think it is going somewhere.
Just want to mention that in the video on Open Source Circular Economy I made I present a “fixed version” of the butterfly diagram with plural.